Vivienne Reiner and Arunima Malik
It’s a material world but how much can we take? New tool reveals hidden carbon hotspots
Imagine having the whole world’s physical consumption at your fingertips – to be able to see what we consume from where, and crucially, the carbon hotspots due to humanity’s unsustainable lifestyles?
This data, along with its interactive visualisation, is now available via an open-access United Nations tool developed by an international group of researchers. And it is uncovering previously hidden key sources of greenhouse gas (GHG) emissions, as well as other environmental and socio-economic impacts.
So while it is well known that Australia is a major exporter of fossil fuels, our biggest GHG footprint is due to buildings caused largely by the energy and materials used in their construction. A key policy change focusing on coal alternatives would slash the dirty electricity underpinning supply chains in Australia (in addition to green steel through green hydrogen) – which would have a significant impact on emissions globally, as well as improving our local environment.
The ‘material footprint’ was first quantified a few years ago as a once-off study by a team led by UNSW and the University of Sydney’s Integrated Sustainability Analysis (ISA) research group, using the detailed, global Eora supply-chain database built by ISA. With funding from the United Nations, ISA has constructed a new database (GLORIA) feeding into UN initiatives for assessing global material flows among other footprints.
The tool’s main purpose is to improve our sustainability by showing what until now was largely hidden – just what regions and industries are climate change hotspots, driven by our demand for goods. It’s no surprise that the most populous countries, China, the United States and India, have the biggest carbon footprints — but next in line is a country that punches above its weight for affluent consumption: Japan.
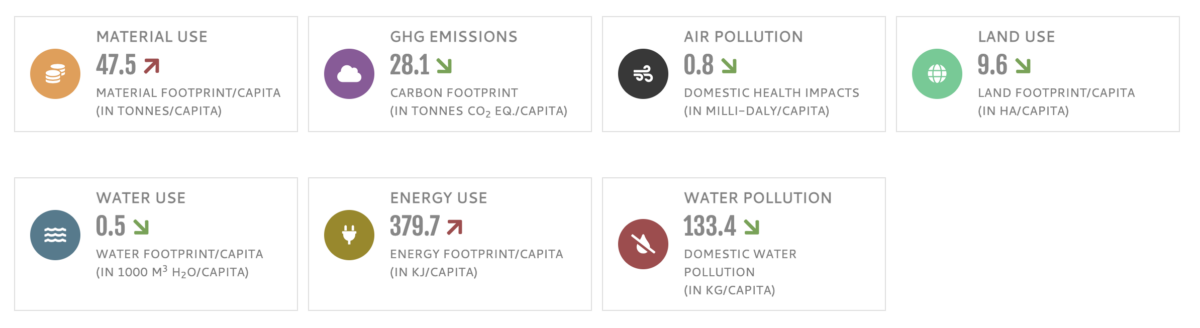
The portal reveals who produces and consumes the most materials/physical resources – leading to pollution among other outputs – and also includes highly detailed information at the regional level. A wide range of environmental, social and economic indicators are included for comparative triple-bottom-line analysis, with data updated regularly to facilitate decision-making and reporting.
The tool is not as difficult to use as its (slightly cumbersome) name might suggest: the Sustainable Consumption and Production Hotspot Analysis Tool (SCP-HAT, for short).
It allows people to look at impacts from both the more traditional ‘production’ perspective – impacts physically produced in the country in question – or instead relegate responsibility to demand along the global supply chain all the way to the end consumer, called ‘footprinting’.
What’s your footprint?
For the first time anyone can quantify in a standardised way, impacts related to the UN’s Sustainable Development Goals (SDGs). The tool’s creators intended that countries could monitor and report their progress towards the material footprint indicators SDGs 8.4 and 12.2, while businesses and individuals can also scrutinise details of interest. The tool has also been set up to be able to extend, eventually, to quantify performance against the other SDGs.
Because the material footprint is comprised of all raw materials taken from the earth to support our lifestyles, including fossil fuels, a focus is the ‘climate change impact hotspots’. Other related impacts that can be analysed in SCP-HAT range from scarce water and biodiversity to indicators like jobs and income, upon which to compare the costs but also to weigh up the relative benefits.
Having a beef with ‘indirect’ emissions
Gone are the days of single-origin – today’s products are better described by Global Value Chains: to get an accurate picture we need to include the impact from all inputs, not just the end product. Incorporating billions of supply chains, SCP-HAT extends beyond a country or sector’s direct impacts to include the much more significant cumulative indirect impacts across the supply chain. It is underpinned by input-output analysis (IO) – the only methodology that can incorporate the entire supply chain – and draws on the GLORIA database that is maintained by ISA.
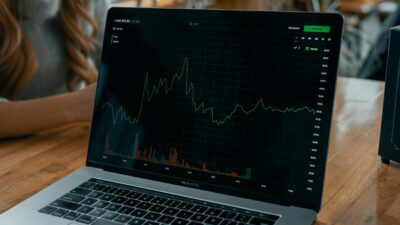
Presented through graphs and charts and updated regularly, the IO-based SCP-HAT makes the analysis easily accessible despite the portal charting the world economy in one database. The impacts of complex interactions can yield surprising results. For example, research for a Greenhouse Gas Protocol Technical Working Group by Lenzen and Murray found that in the data-processing sector, the second-biggest contributor to GHGs were indirect emissions buried deep in its supply chains: beef used by hotels, clubs, restaurants and cafes – consumed by the sector in catering, conferences and industry dinners etc.
Of course, for fossil fuel companies, the majority of emissions created in producing the energy will be on-site rather than from upstream suppliers.
There’s no getting around it – input must equal output
Decades ago, economist Wassily Leontief came up with a formula and methodology to quantify the pollution resulting from activity in an economy, which took into account not just impacts from direct actions but including indirect suppliers, referred to as ‘scope 3’. Called input-output analysis (IO), the methodology rose to prominence and won Leontief a Nobel Prize in 1973 when the oil shocks were at a peak – sound familiar? Developed further to take account of our globalised world, multi-region IO/MRIO, pioneered by ISA among others, is now routinely employed at the highest levels, from Deloitte to the World Bank and the UN (check out ISA’s Eora global MRIO database).
Importantly, IO is comparable across industries and countries, being based on input-output tables (IOT) from national accounts and governed by standards set by the UN. By linking to social and environmental data, IO can quantify any impacts related to the economy.
Google, Amazon and the missing scope-3 emissions
Despite these advances, a number of multinationals including Google and Amazon made headlines this year for ‘misleading’ on carbon emissions by ignoring scope-3 emissions. While this might seem to be a significant omission, many companies do not voluntarily account for scope-3 emissions.
Tailored organisational scope-3 emissions can be quantified and modelled by IO software and experts like ISA but the new SCP-HAT makes the global insights readily accessible and complements the carbon footprinting with other environmental and socio-economic indicators for holistic analysis.
The launch of SCP-HAT fills a gap by providing global access to footprinting of carbon and other impacts incorporating the entire supply chain. It provides for the first time a comparable dashboard of global footprints, including nations’ carbon footprints, signalling our climate-change hotspots.
The results, which are relevant for non-experts and national decision-makers alike, highlight where changes are urgently required to make the most impact.
Image: Marek Piwnicki
Vivienne is a PhD candidate at the Integrated Sustainability Analysis (ISA) group at the University of Sydney. Her research is interdisciplinary, spanning economic, social and environmental impacts and modelling.
Arunima is a Senior Lecturer in the Integrated Sustainability Analysis (ISA) Group at the University of Sydney. Her research is interdisciplinary, and focusses on the appraisal of social, economic and environmental impacts using input-output analysis. She was part of the team that won the 2022 Eureka Prize for Excellence in Interdisciplinary Scientific Research.